Acknowledgements
The authors gratefully acknowledge the management of the Ourhoud Organisation and partners for permission to publish this manuscript.
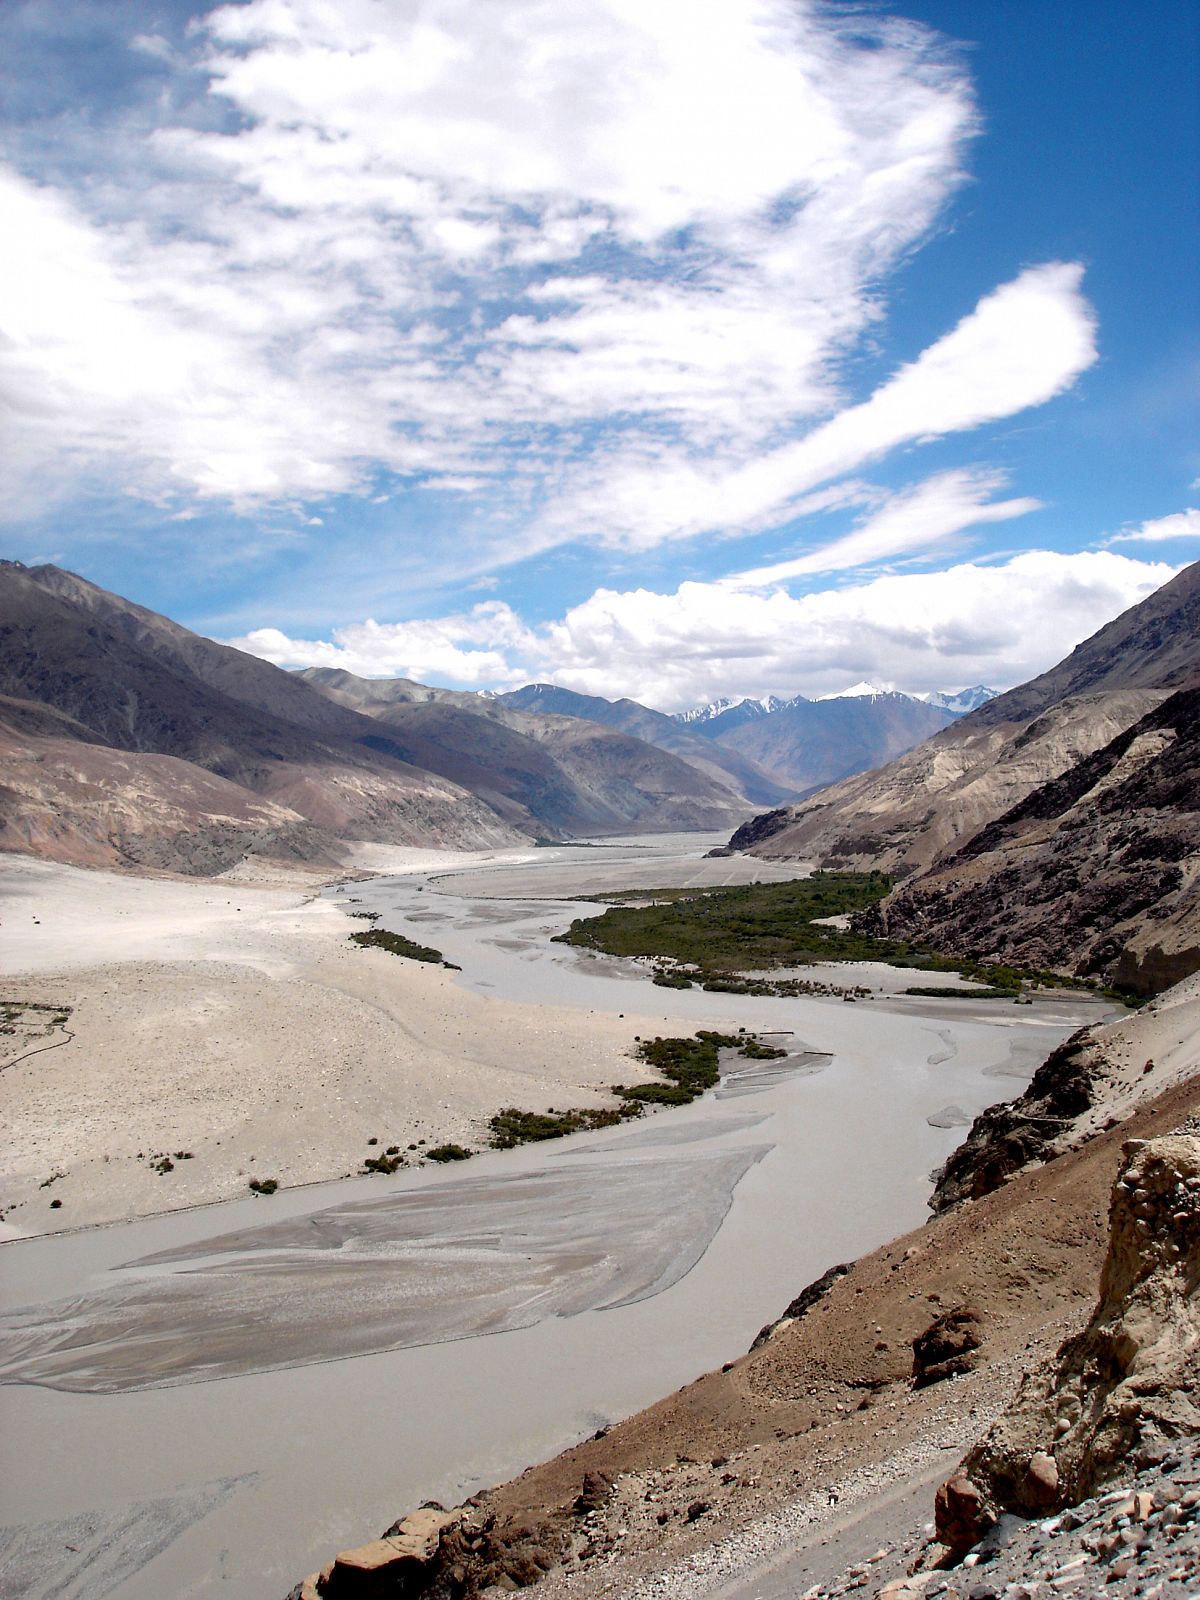
OURHOUD FIELD LOCATION AND LITHOSTRATIGRAPHY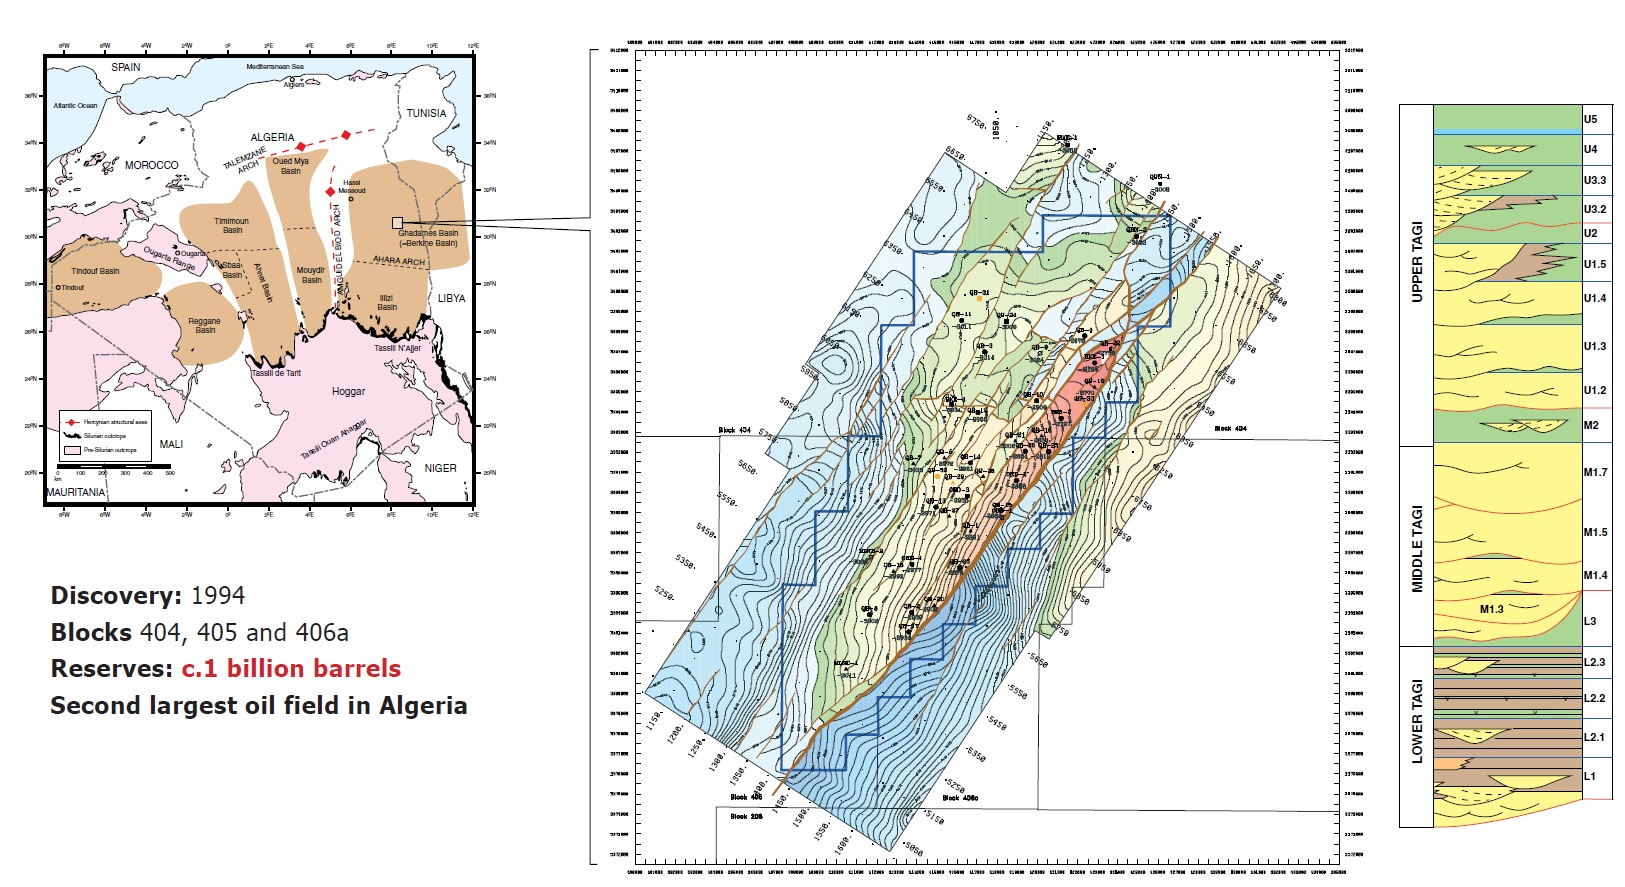
SEDIMENTOLOGICAL BACKGROUND
2 previous models
• chott basin – with m-scale meandering and braided channels large-scale meandering channels (15m point bars).
• these have different implications for sandbody connectivity and internal reservoir heterogeneity
AIMS OF BHI ASSESSMENT
The main aims were to assess:
• the scale of genetic associations, hence define or refine depositional models
• the geometry and preferred orientation of these associations
SEDIMENTARY BUILDING BLOCKS
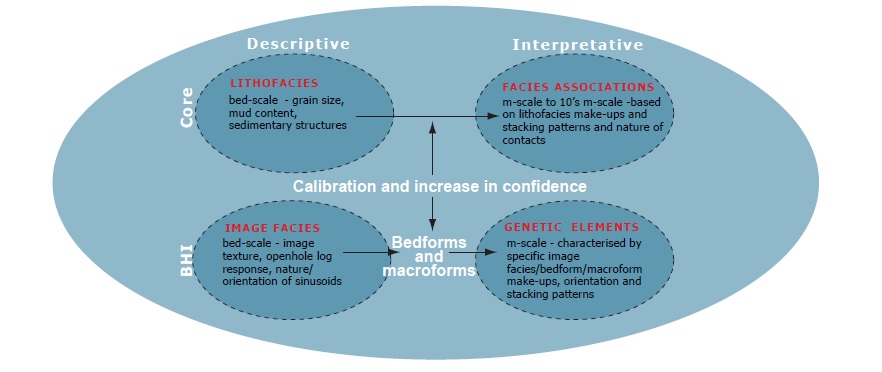
STUDY DATABASE AND APPROACH
Over 30 UBI images have been calibrated with 22 fully cored wells.
• BAAL devise a descriptive, reproducible image facies and dip classification scheme
• qualitatively assess dip patterns and images
• integrate image data with:
• core-sedimentology logs
• autocar data
• interpretation of bedforms, macroforms, channel type and genetic element composition
• full-field reservoir correlation using an event stratigraphic approach
• reservoir layer mapping through integration of all available datasets
MACROFORMS AND GENETIC ELEMENTS
Bedforms stack to form two types of macroform:
• lateral Accretionary
• downstream Accretionary Seven genetic elements have been identified based on:
• component image facies
• dip pattern (eg. dominant bedform)
• inferred macroforms
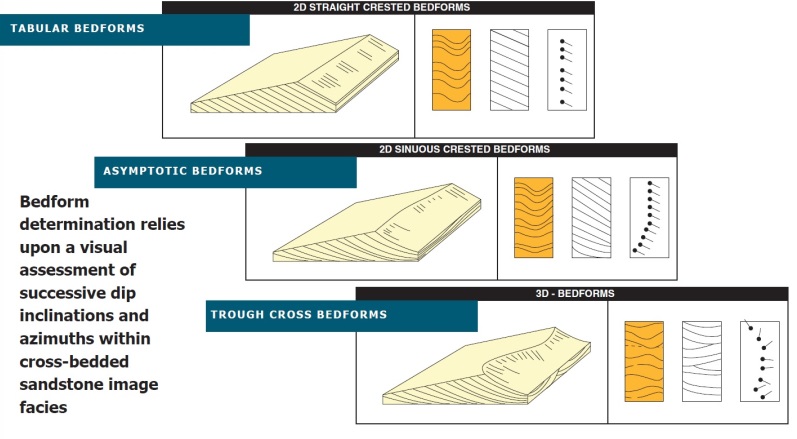
SCHEMATIC EXAMPLES OF BEDFORMS
DOWNSTREAM ACCRETIONARY MACROFORMS: LOW SINUOSITY CHANNEL-FILLS 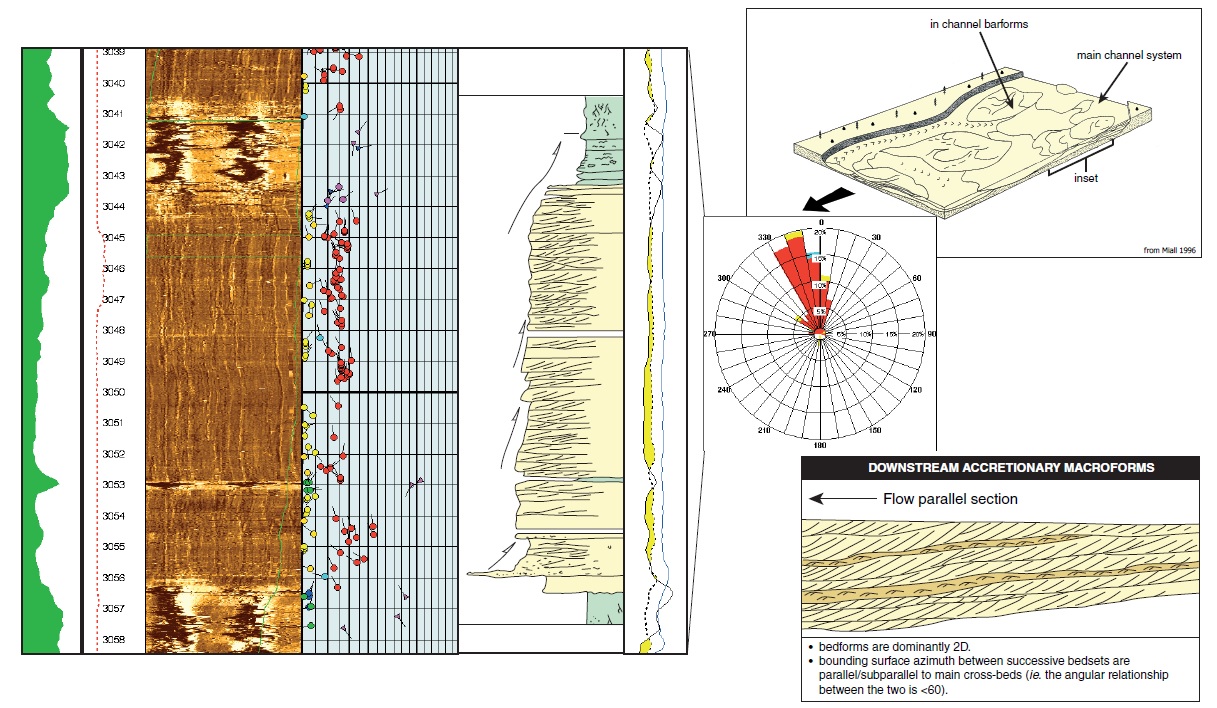
LATERAL ACCRETIONARY MACROFORMS: HIGH-SINUOSITY CHANNEL-FILLS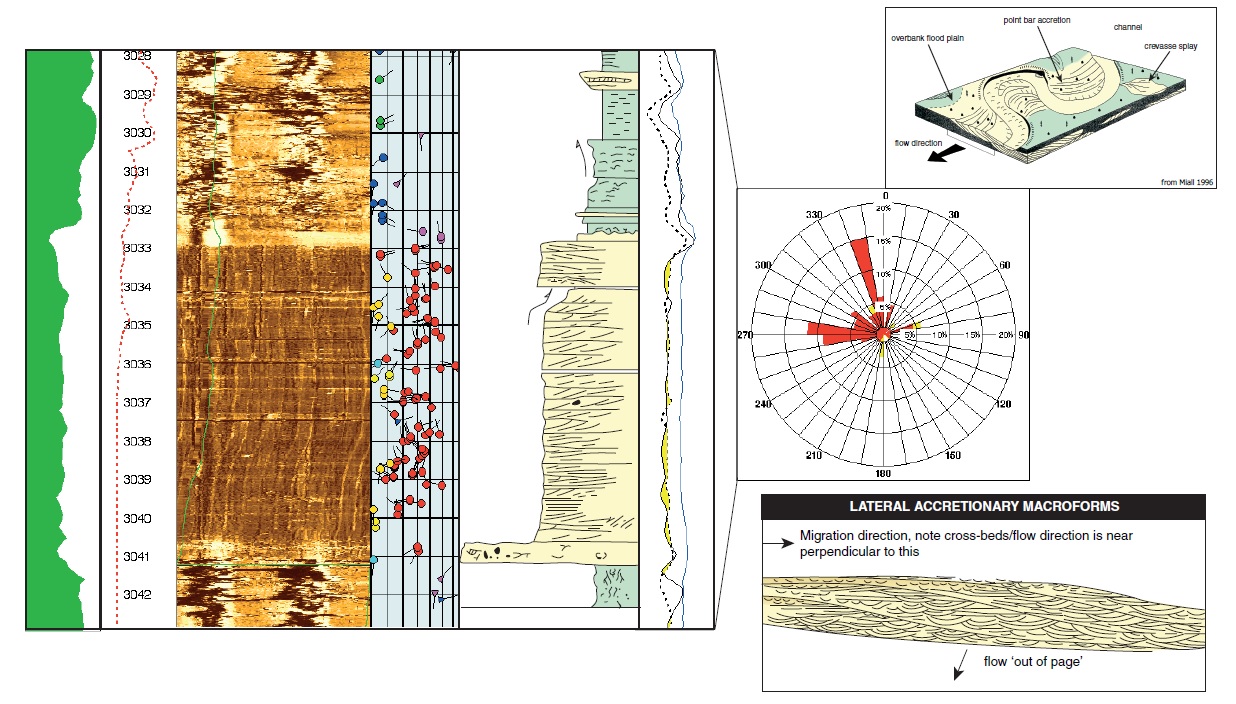
OTHER EXAMPLES OF GENETIC ELEMENTS
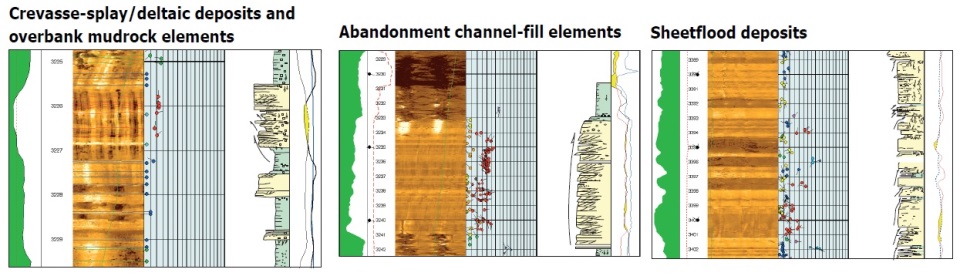
LOW-AMPLITUDE ELEMENTS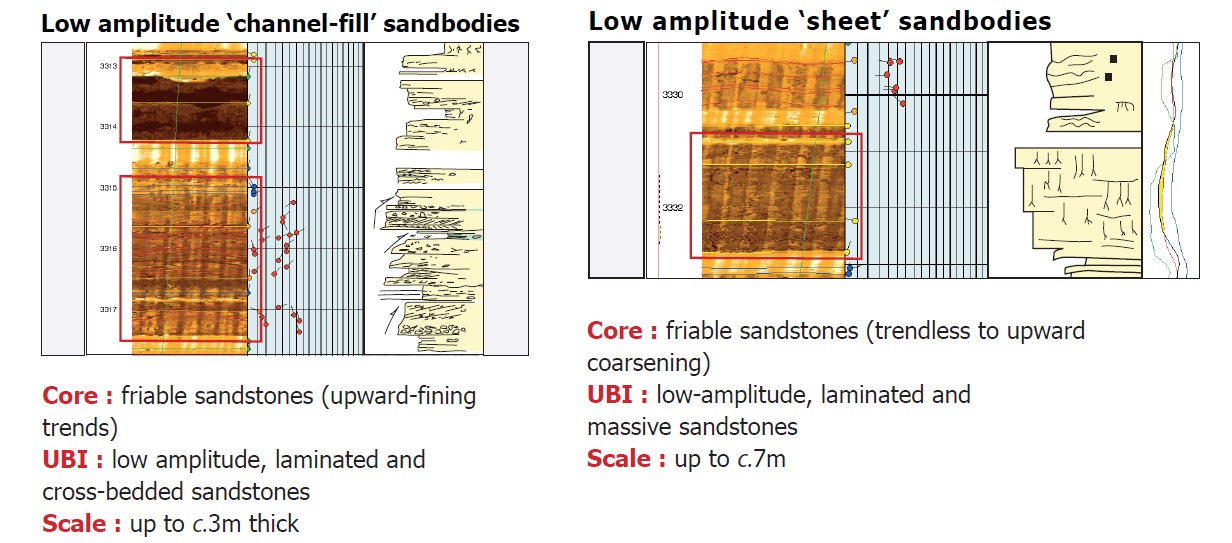
GENETIC ELEMENT DISTRIBUTION WITHIN THE TAGI
• detailed correlation using the integrated bhi, openhole log andcore datasets
• followed by schematic facies mapping
• provides an improved understanding of sandbody distribution, geometries, orientations within the tagi reservoir intervals
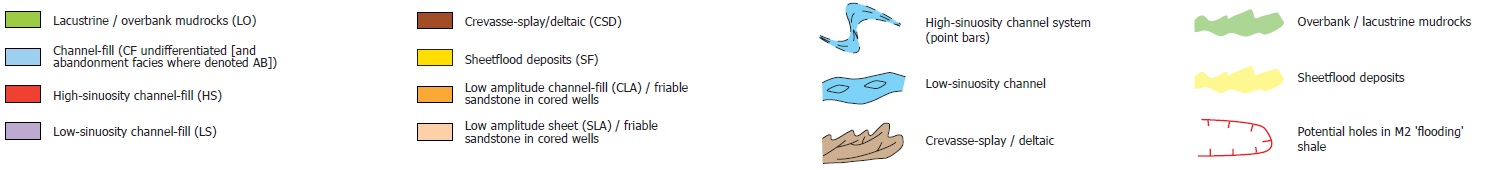
KEY TO DISTRIBUTION MAPS
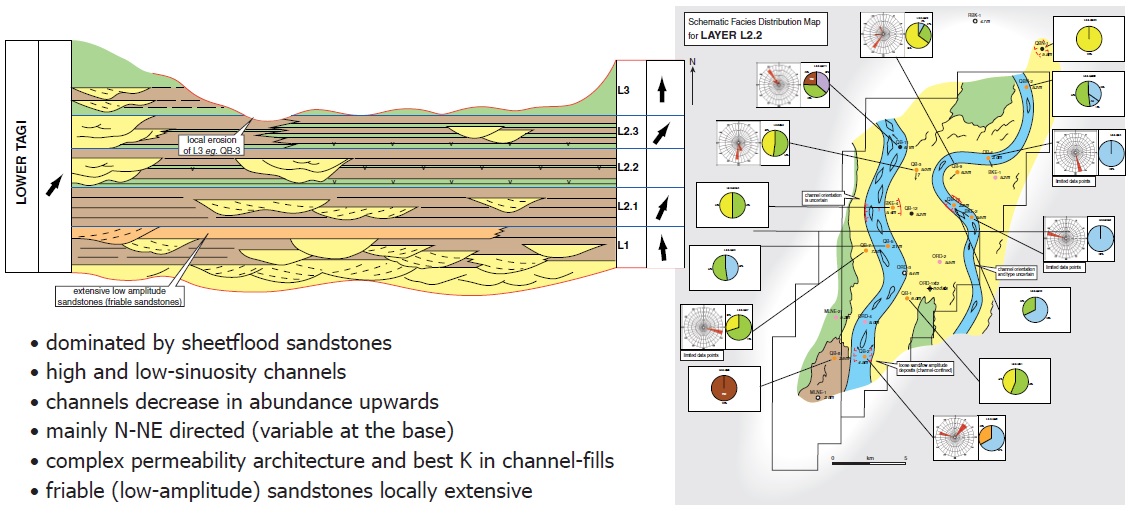
LOWER TAGI
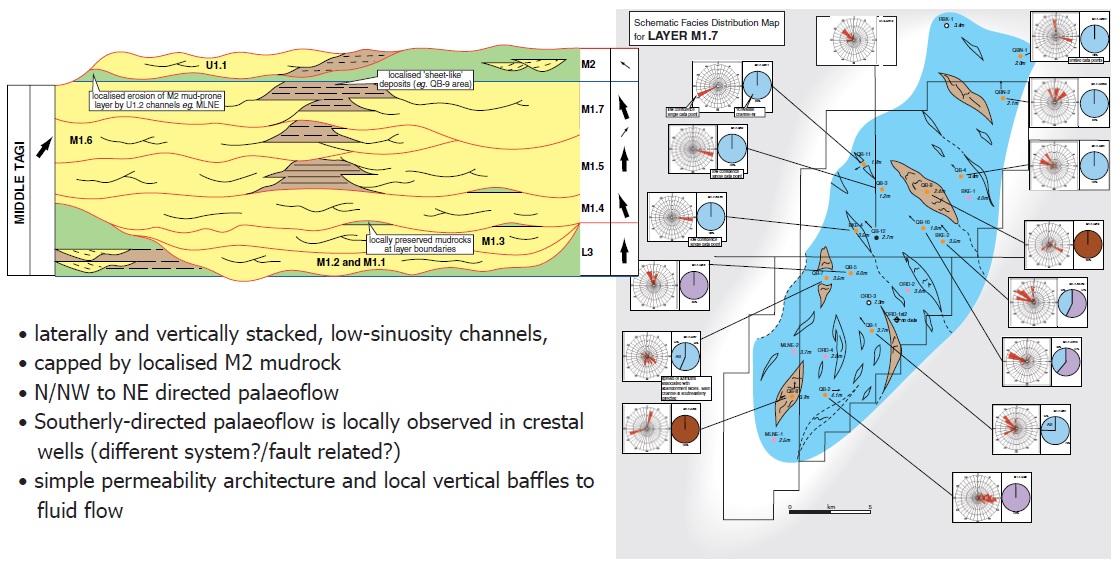
MIDDLE TAGI
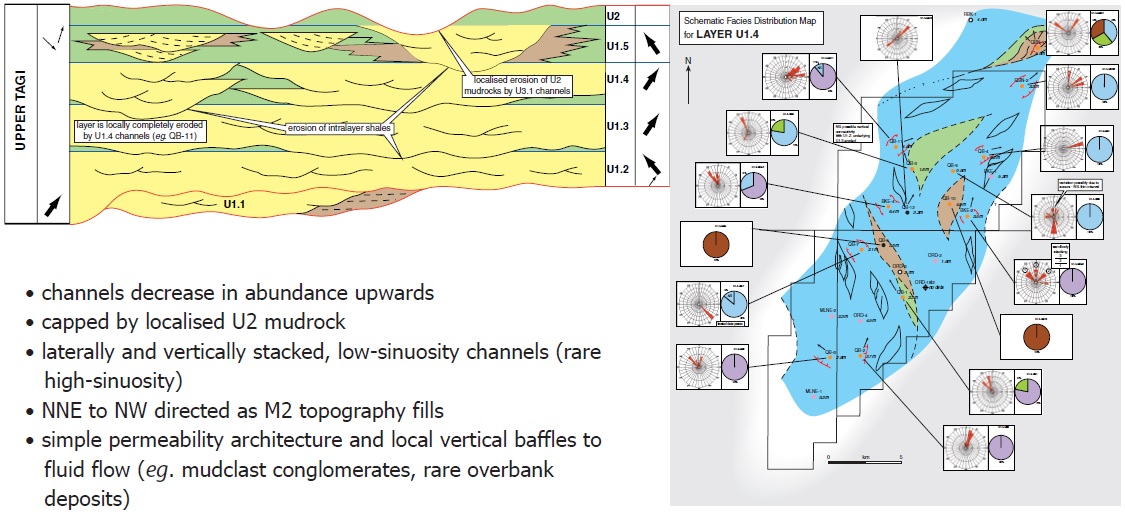
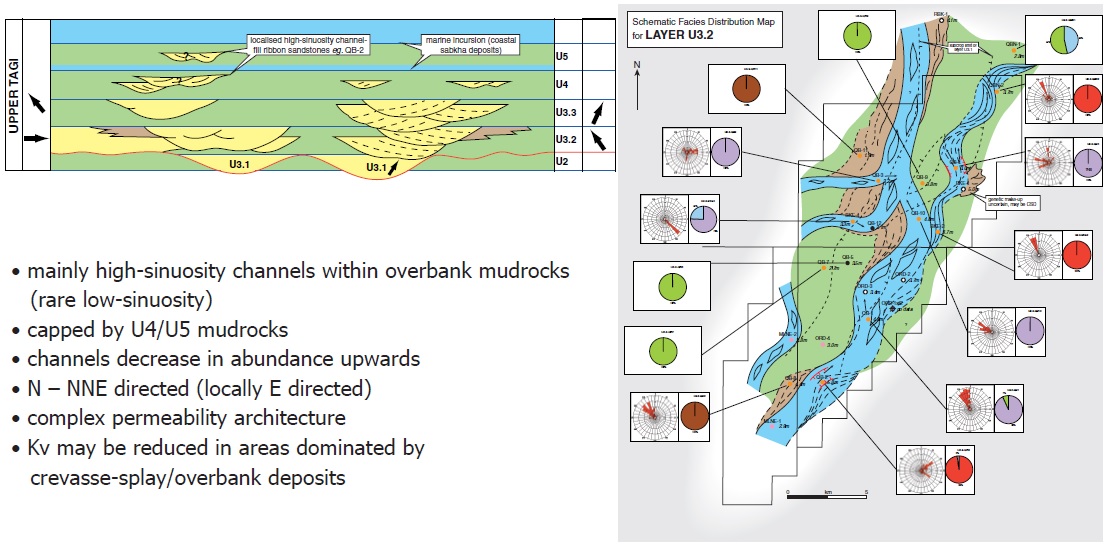
UPPER TAGI (LOWER PART)
UPPER TAGI (UPPER PART)
SYNOPSIS
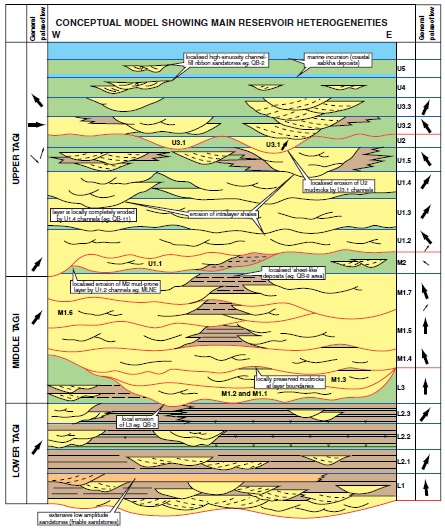
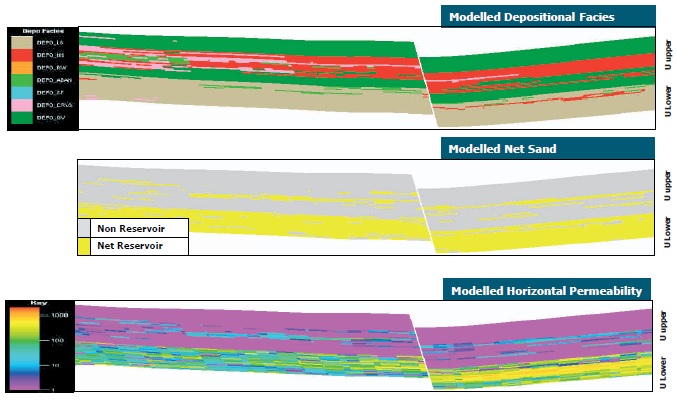
• Upper TAGI (upper)
• moderate N:G and complex K architecture
• variable palaeoflow
• Upper TAGI (lower)
• high N:G and simple K architecture
• consistent palaeoflow
• U2 mudrock barrier/baffle
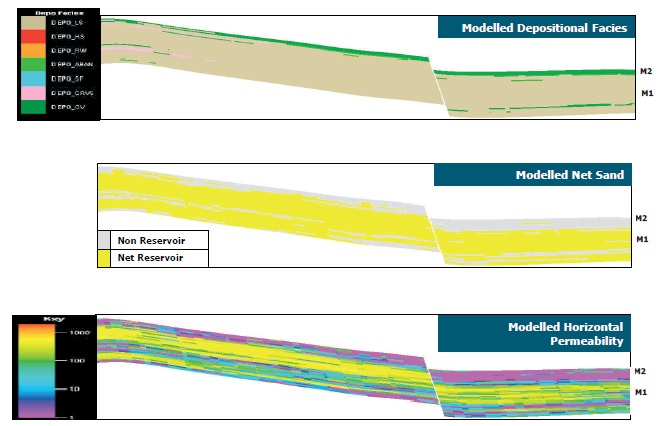
• Middle TAGI
• high N:G and simple K architecture
• consistent palaeoflow
• M2 mudrock barrier/baffle
• Lower TAGI
• high to low N:G and complex architecture
• variable palaeoflow
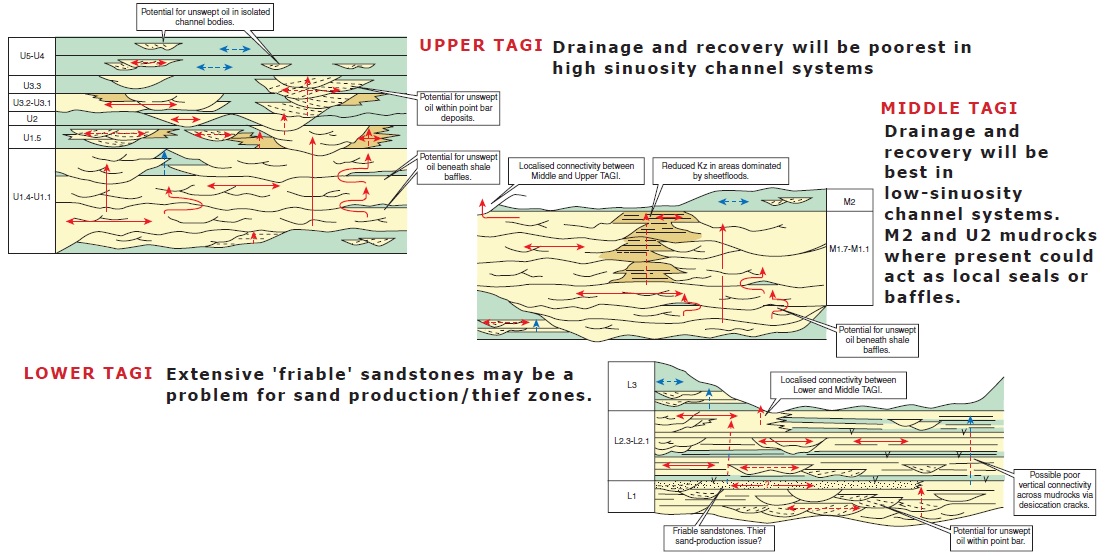
POTENTIAL IMPACT ON RECOVERY
MODELLED LOWER TAGI
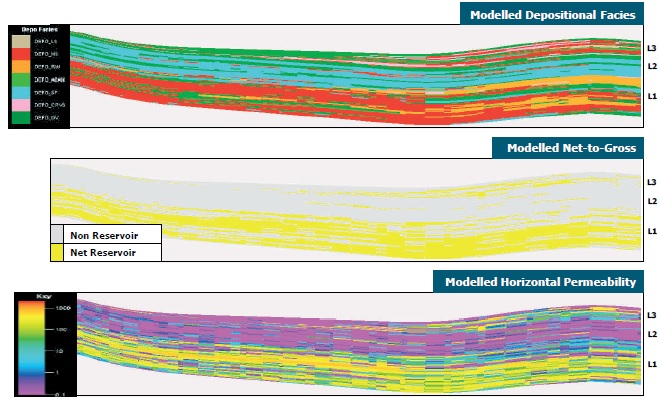
MODELLED MIDDLE TAGI
MODELLED UPPER TAGI
CONCLUSIONS
The integrated UBI study of the TAGI Formation of Ourhoud Field assessed the overall sedimentology and identified the component genetic elements and their distribution.
Achievements:
• constrained scale of genetic elements
• constrained depositional model: both chott and meandering models can be applied to different parts of the stratigraphy
• both high and low-sinuosity channel-types recognised – modelling implication: different sandbody geometries and permeability architectures
• identified palaeoflow variability – modelling implication: can constrain preferred permeability pathways